What Is a Truck Tire Pressure Chart?
Sai Gon, 8 Mar, 2026. A truck tire pressure chart is a technical guide that shows the relationship between tire load and the minimum inflation pressure needed to safely support that load. It helps drivers and fleet operators determine the correct PSI based on tire size, axle load, and operating conditions.
By referencing this chart, operators can set accurate pressure for common sizes like 11R22.5, 295/75R22.5, 12R22.5 and 315/80R22.5. Proper inflation improves stability, reduces fuel use, ensures even tread wear, and helps prevent overheating or premature tire failure. In short, it is a critical tool for safe, efficient heavy-duty truck operation.
Why Proper Commercial Truck Tire Pressure Matters for Safety & ROI
Maintaining correct truck tire pressure is essential for safety and operating efficiency. Proper inflation improves road contact, braking stability, and vehicle control while reducing heat buildup — one of the leading causes of blowouts in heavy-duty trucking. Correct tire pressure also helps drivers maintain better stability and confidence on long-distance routes.
Proper inflation significantly reduces operating costs as well. Lower rolling resistance improves fuel efficiency, and according to the United States Environmental Protection Agency, a 10 PSI pressure drop can reduce fuel economy by 0.5–1%. Tire lifespan is also heavily affected: operating tires 20% under-inflated may shorten service life by up to 30%.
These benefits lead to lower fuel expenses, fewer tire replacements, and reduced maintenance costs. A truck tire pressure chart helps fleets match PSI to actual load conditions, improving both tire performance and long-term fleet efficiency.
3 Dangerous Truck Tire Inflation Mistakes to Avoid
Even experienced drivers sometimes set truck tire pressure incorrectly. These mistakes usually come from misunderstanding tire markings, relying on outdated habits, or misinterpreting vehicle weight distribution. Understanding the most common errors can help drivers maintain proper inflation, improve tire life, and reduce the risk of tire failure on the road.
Mistake 1: Blindly Using the Max PSI Printed on the Sidewall
The PSI printed on a truck tire sidewall indicates the maximum pressure the tire can safely handle at maximum load — not the recommended daily operating pressure. It represents the structural limit of the tire casing under full-load conditions.
Many drivers mistakenly use this number as the standard running pressure. In reality, proper inflation should be determined using the manufacturer’s Load & Inflation Table or a truck tire pressure chart based on actual axle load. Using sidewall PSI as operating pressure can cause overinflation, reduced traction, uneven wear, and a higher risk of blowouts at highway speeds.
Mistake 2: Relying on “Thumb Pressure” or Old Driver Habits
Another common mistake is relying only on traditional rules or advice from experienced drivers when setting truck tire pressure. While experience remains valuable, modern truck tires use advanced rubber compounds, casing designs, and updated load ratings that differ significantly from older generations.
As tire technology evolves, inflation practices that worked decades ago may no longer suit today’s tires. The correct approach is to follow the manufacturer’s Load & Inflation Table, which determines the proper PSI based on actual axle load and tire specifications rather than outdated assumptions or sidewall-based rules.
Mistake 3: Confusing Gross Vehicle Weight (GVW) with Axle Load

Truck tire pressure should always be based on axle load rather than total vehicle weight. Each axle carries a different portion of the load, so inflation pressure must match the weight supported by that specific axle.
For example, cab-over trucks commonly used in Europe and Japan place the cab and engine directly above the steer axle, creating higher front-axle loads. As a result, steer tires often require higher inflation pressure.
In contrast, conventional American trucks position the engine ahead of the cab, shifting more weight toward the drive axles once a trailer is attached. Because of these design differences, using the same PSI across different truck types can easily cause underinflation or overinflation.
To maintain proper truck tire pressure, fleets should measure actual axle loads and follow the manufacturer’s Load & Inflation Table or truck tire pressure chart to determine the correct PSI for each axle.
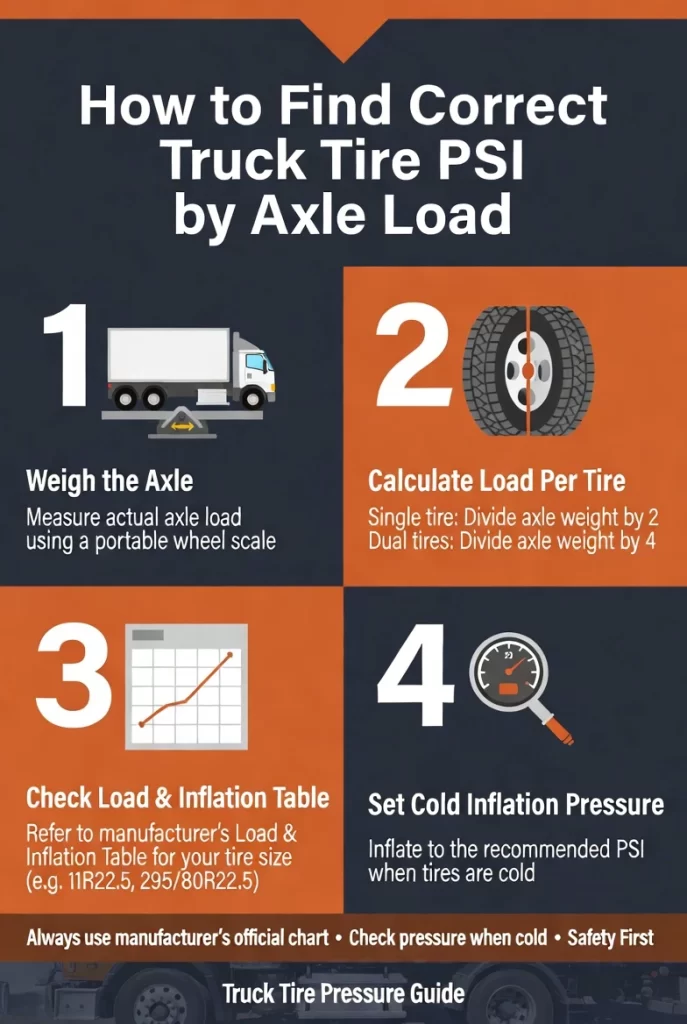
Step-by-Step: How to Find Your Target Truck Tire PSI
Correct truck tire pressure is determined by measuring axle load, calculating per-tire load, and matching the result to the manufacturer’s Load & Inflation Table.
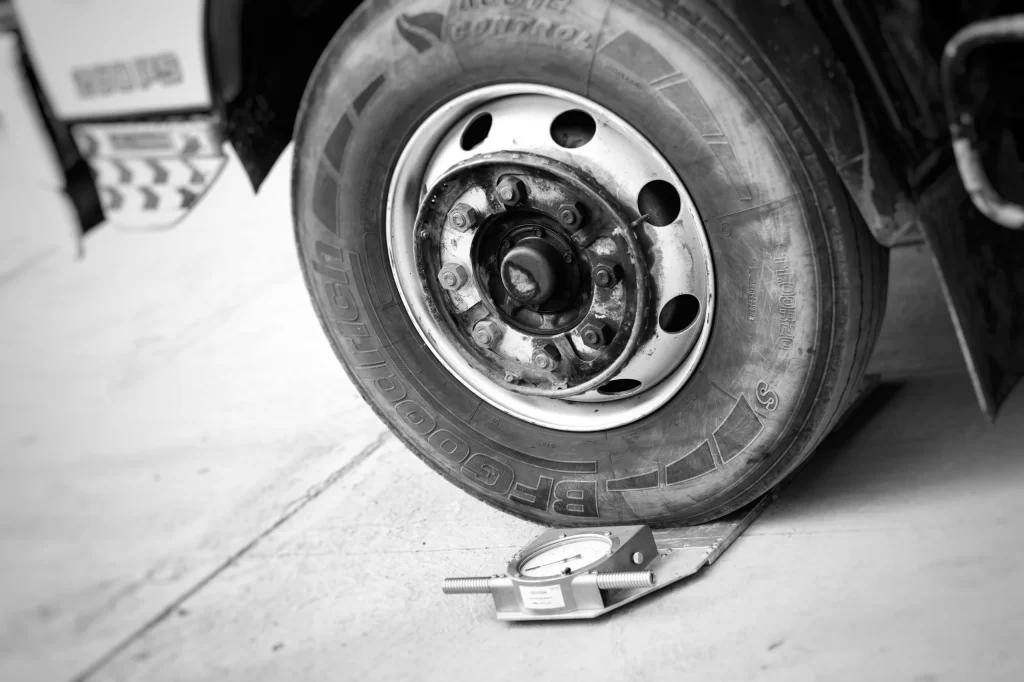
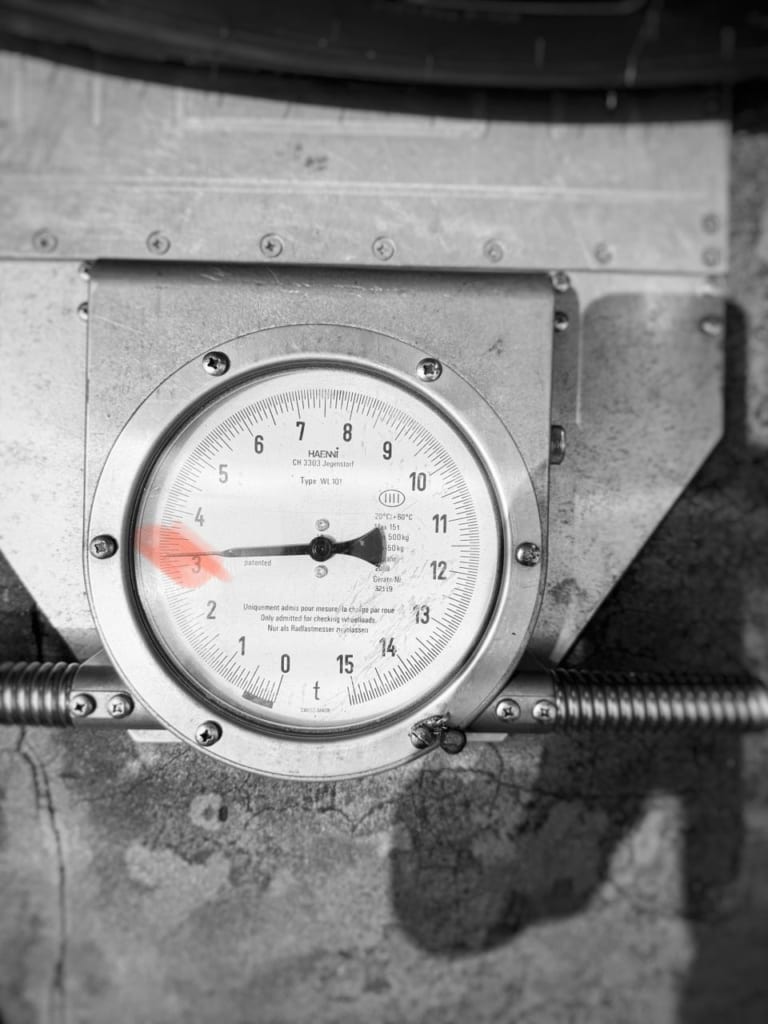
The process begins by weighing each axle individually using an axle scale. This is the only reliable way to understand how weight is distributed across the steer, drive, and trailer axles, since total vehicle weight alone does not reflect actual load distribution.
Cargo type and loading position can significantly affect axle loads. Dense cargo creates concentrated weight, while bulky freight distributes weight more evenly. Moving cargo forward or backward can also change the required tire pressure.
For this reason, fleets should weigh trucks under maximum expected payload conditions and set tire pressure according to the highest axle load the vehicle is expected to support.
Step 1: Converting Axle Weight to Individual Tire Load
After weighing the truck, the next step is converting axle weight into the load carried by each tire. Tire pressure is based on individual tire load, not total axle weight. For a single-tire axle, divide axle weight by two; for a dual-tire axle, divide by four.
Once the per-tire load is known, fleets should consult the manufacturer’s Load & Inflation Table for the exact tire model and size, such as 11R22.5 or 295/80R22.5. This chart specifies the minimum cold inflation pressure required for a given load.
Using the correct per-tire load ensures inflation pressure matches the manufacturer’s engineering standards, improving load support, stability, tread wear, and tire life — especially in heavy-duty or long-haul operations.
Step 2: How to Read a Standard Tire Load & Inflation Table
A truck tire pressure chart lists tire sizes alongside the maximum load each tire can support at specific inflation pressures. Drivers simply locate the tire size and match the per-tire load to the corresponding PSI value.
Truck Tire Pressure Chart – 11R22.5 (Continental Technical Data)
The following table shows the certified relationship between cold inflation pressure and maximum load capacity for 11 R 22.5 commercial truck tires, based on official manufacturer technical specifications.
| Inflation Pressure (bar / PSI) |
Tire Fitment | Maximum Load Capacity (lbs / kg) |
|---|---|---|
| 6.0 bar (87 PSI) |
Single (S) Dual (D) |
10,505 lbs / 4,765 kg 19,345 lbs / 8,775 kg |
| 6.5 bar (94 PSI) |
Single (S) Dual (D) |
11,200 lbs / 5,080 kg 20,625 lbs / 9,355 kg |
| 7.0 bar (102 PSI) |
Single (S) Dual (D) |
11,885 lbs / 5,390 kg 21,890 lbs / 9,930 kg |
| 7.5 bar (109 PSI) |
Single (S) Dual (D) |
12,555 lbs / 5,695 kg 23,125 lbs / 10,490 kg |
| 8.0 bar (116 PSI) |
Single (S) Dual (D) |
13,230 lbs / 6,000 kg (Max) 24,360 lbs / 11,050 kg (Max) |
| 8.5 bar (123 PSI) |
Single (S) Dual (D) |
— 25,575 lbs / 11,600 kg |
Note: Values shown are example load and inflation references for commercial truck tires. Actual load capacity and required tire pressure may vary depending on tire size, load index, and manufacturer specifications.
Truck Tire Pressure Chart – 12R22.5 (Continental Technical Data)
| Inflation Pressure (bar / PSI) |
Tire Fitment | Maximum Load Capacity (lbs / kg) |
|---|---|---|
| 6.0 bar (87 PSI) |
Single (S) Dual (D) |
11,840 lbs / 5,370 kg 21,020 lbs / 9,535 kg |
| 6.5 bar (94 PSI) |
Single (S) Dual (D) |
12,620 lbs / 5,725 kg 22,410 lbs / 10,165 kg |
| 7.0 bar (102 PSI) |
Single (S) Dual (D) |
13,390 lbs / 6,075 kg 23,780 lbs / 10,785 kg |
| 7.5 bar (109 PSI) |
Single (S) Dual (D) |
14,150 lbs / 6,420 kg 25,120 lbs / 11,395 kg |
| 8.0 bar (116 PSI) |
Single (S) Dual (D) |
14,900 lbs / 6,760 kg 26,455 lbs / 12,000 kg |
| 8.5 bar (123 PSI) |
Single (S) Dual (D) |
15,655 lbs / 7,100 kg (Max) 27,780 lbs / 12,600 kg (Max) |
Note: Load and inflation values shown are reference data for commercial truck tires. Actual tire pressure requirements may vary depending on tire brand, load index, speed rating, and operating conditions.
Truck Tire Pressure Chart – 295/80R22.5 (Continental Technical Data)
The following table shows the certified relationship between cold inflation pressure and maximum load capacity for 295/80R22.5 commercial truck tires based on official manufacturer technical specifications.
| Inflation Pressure (bar / PSI) |
Tire Fitment | Maximum Load Capacity (lbs / kg) |
|---|---|---|
| 6.0 bar (87 PSI) |
Single (S) Dual (D) |
11,330 lbs / 5,140 kg 20,580 lbs / 9,335 kg |
| 6.5 bar (94 PSI) |
Single (S) Dual (D) |
12,080 lbs / 5,480 kg 21,935 lbs / 9,950 kg |
| 7.0 bar (102 PSI) |
Single (S) Dual (D) |
12,820 lbs / 5,815 kg 23,280 lbs / 10,560 kg |
| 7.5 bar (109 PSI) |
Single (S) Dual (D) |
13,550 lbs / 6,145 kg 24,605 lbs / 11,160 kg |
| 8.0 bar (116 PSI) |
Single (S) Dual (D) |
14,265 lbs / 6,470 kg 25,905 lbs / 11,750 kg |
| 8.5 bar (123 PSI) |
Single (S) Dual (D) |
14,770 lbs / 6,700 kg (Max) 27,115 lbs / 12,300 kg (Max) |
Note: Load and inflation values shown are reference data for 295/80R22.5 commercial truck tires. Actual tire pressure requirements may vary depending on tire brand, load index, speed rating, and operating conditions.
How to interpret the chart:
- Single = one tire per side of the axle
- Dual = two tires per side of the axle
- PSI = minimum cold inflation pressure required for the specified load
For example, an 11 R 22.5 tire operating in a single configuration and carrying a measured load of 5,390 kg requires a minimum cold inflation pressure of approximately 102 PSI (7.0 bar) according to the Load & Inflation Table.
Practical Example: A Sample Truck Tire Pressure Chart
Example of a manufacturer Load & Inflation Table
The table above illustrates how tire manufacturers define the relationship between inflation pressure and load capacity. Each column represents a specific inflation pressure level, while the values in the table indicate the maximum load the tire can carry at that pressure. Separate rows are provided for single and dual tire configurations because load distribution differs between these setups.
By locating the calculated per-tire load and selecting the corresponding pressure column, drivers can determine the minimum cold inflation pressure required for safe operation.
Crucial Safety Factors: Understanding Speed, Load, and Pressure Relationships
When using a tire manufacturer’s Load & Inflation Table, it is essential to interpret the information correctly to avoid setting the wrong pressure. Below are the key points every driver and fleet operator should keep in mind:
- PSI shown is the minimum cold inflation pressure
The listed PSI is the minimum pressure required when the tire is cold to safely support the specified load. Inflation below this level can cause excessive heat buildup and reduced load capacity. - If your exact load is not listed, select the next higher PSI
Load values are grouped in increments. When the calculated per-tire load falls between two values, always choose the higher pressure to maintain a safety margin. - Do not cross-use tables between different brands
Different manufacturers use different casing constructions and load ratings. A PSI value from one brand may not apply to another tire model, even in the same size. - Inflation values assume proper load distribution
Load tables assume weight is evenly distributed across the axle. Uneven cargo placement can overload one side of the vehicle even when total axle weight appears acceptable. - Confirm values with technical support when necessary
If the table includes multiple application conditions or operating limits, fleets should verify the correct pressure with the tire manufacturer or technical representative.
What Happens If Your Axle Load Exceeds the Chart Limits?
If the actual axle or per-tire load exceeds the maximum value in the Load & Inflation Table, the tire is operating beyond its certified capacity. Increasing inflation pressure cannot safely compensate for an overload.
At this point, the tire cannot support the weight even at maximum allowable PSI. The only safe solutions are reducing vehicle load, redistributing cargo to balance axle weights, or upgrading to a tire with a higher load index.
Overloaded tires generate excessive heat, accelerate casing fatigue, and increase the risk of rapid air loss or structural failure. When load exceeds the manufacturer’s limit, the correct solution is to reduce the load or use a higher-capacity tire — not exceed the specified pressure range.
Example: Understanding the Speed / Load / Pressure Relationship
For example, according to the Michelin Speed / Load / Pressure Combination chart, a truck tire with a speed symbol L (120 km/h) may carry up to 12% more load when operating at 60 km/h, provided the inflation pressure is increased by approximately 8%.
This means additional load is only permitted when the vehicle operates below its maximum speed rating and the tire pressure is increased to control heat buildup.
As vehicle speed approaches the tire’s rated limit, both the allowable load increase and pressure adjustment gradually return to zero. This demonstrates the direct relationship between load, inflation pressure, and operating speed, which must be balanced to maintain tire safety and durability.
Summary: Key Takeaways for Correct Truck Tire Maintenance
- Weigh each axle to determine the actual load distribution across the vehicle
- Convert axle weight into per-tire load based on single or dual tire configuration
- Use the tire manufacturer’s Load & Inflation Table to find the required PSI
- Adjust tire pressure according to the recommended cold inflation value
- Regularly inspect and monitor tire pressure to maintain safety, fuel efficiency, and tire lifespan
If there is any uncertainty about load calculations or inflation settings, fleets should consult an authorized dealer or the tire manufacturer’s technical representative for accurate recommendations.
Download the printable Truck Tire Pressure Chart PDF for workshop, fleet, and driver reference.
Important Notice: The charts and downloadable PDF files provided in this article are for reference purposes only. Always consult and follow the latest official Load & Inflation Table provided by the specific tire manufacturer for the exact tires installed on your vehicle. Certified inflation values may vary depending on the tire model, manufacturing year, and specific operating conditions.
📥 Download Official Load & Inflation Charts (PDF)
Save these high-resolution technical data sheets offline on your phone or print them out for quick reference in your fleet’s garage. Never guess your tire pressure again.
Continental Load & Inflation Data Sheet (Updated 2024)
Complete 2024 technical pressure guide for Continental heavy truck tires, optimized for 11 R 22.5 and 12 R 22.5 sizes.
Bridgestone Commercial Load & Inflation Table (Updated 2023)
Official 2023 Bridgestone engineering standards matching axle load to correct PSI limits for major commercial fleet applications.
Goodyear Truck Tire Load & Inflation Weights (Updated 2023)
Comprehensive 2023 tire pressure chart data straight from Goodyear’s commercial engineering book for proper fleet setup.
Hankook Tire Load & Inflation Table (Updated 2025)
Official 2025 technical chart for Hankook SmartWay verified regional and long-haul commercial vehicle tires.
Pirelli Prometeon Truck Tire Pressure Chart (Updated 2025)
Official 2025 commercial technical data sheet from Prometeon Tyre Group for Pirelli-branded heavy truck solutions.
Frequently Asked Questions (FAQs) About Truck Tire Pressure Charts
The correct truck tire pressure is determined by weighing the axle load, converting it into per-tire load, and matching that value with the manufacturer’s Load & Inflation Table. The table shows the minimum cold inflation pressure required to safely support the load.
No. Increasing tire pressure beyond the manufacturer’s specified range does not safely increase load capacity. If the load exceeds the tire’s rated limit, the correct solution is to reduce the load, redistribute cargo, or use a tire with a higher load index.
Underinflated truck tires create excessive flexing and heat buildup inside the casing. Over time, this can accelerate tread wear, reduce fuel efficiency, weaken the tire structure, and increase the risk of tire failure.
Truck tire pressure should always be checked when tires are cold, meaning the vehicle has been parked for several hours. Manufacturer load and inflation tables are based on cold inflation pressure values.
Truck tire pressure should be checked regularly, ideally before long trips or at least once per week for commercial vehicles. Routine inspection helps detect slow air loss, prevent underinflation, and maintain safe operating conditions.
Technical References
Recommended truck tire pressure values should always be verified using the official load and inflation tables provided by tire manufacturers such as Michelin, Bridgestone, Goodyear, or Continental. These technical documents provide the certified relationship between tire load and minimum cold inflation pressure for each tire model.
Nhat Diem Honq